|
Human Polymorphism and Divergence Data
|
|
This website contains information on the human polymorphism and divergence data used
by INSIGHT. More details are avialble in the Supplementary Materials of
(Gronau et al., Mol Biol Evol, 2013).
More information on INSIGHT can be found here.
|
Contents
1. Polymorphism data
2. Outgroup sequence data and ancestral priors
3. Filters
4. Putative neutral sites
5. Genomic blocks
|
|
1. Polymorphism data
|
|
Human polymorphism sequence data was obtained using the complete high-quality genome sequences of
54 unrelated individuals taken from the
69 public genomes from Complete Genomics.
The 54 unrelated individuals, spanning 11 distinct human populations, were identified by eliminating
13 individuals from the 17-member CEPH pedigree (all but the four grandparents) and the child in each
of the two trios (see Figure).
Genotype calls for these individuals were extracted from the
masterVar files
downloaded from the Complete Genomics FTP site in December, 2011. We considered variants designated as “SNPs” or
“length-preserving substitutions” in the masterVar files, and recorded positions
at which Complete Genomics could not confidently assign a variant call for subsequent
masking (see filters). All other positions were assumed to be homozygous for the reference
allele (according to UCSC hg19 / human genome build 37).
The polymorphism data was summarized by recording for each position in hg19
the allele count for each of the four basses (A,C,G, and T) across the 54x2=108
chromosomes. Sites with more than two observed alleles were masked, as well as sites
masked in one of the 54 individuals (see filters).
|
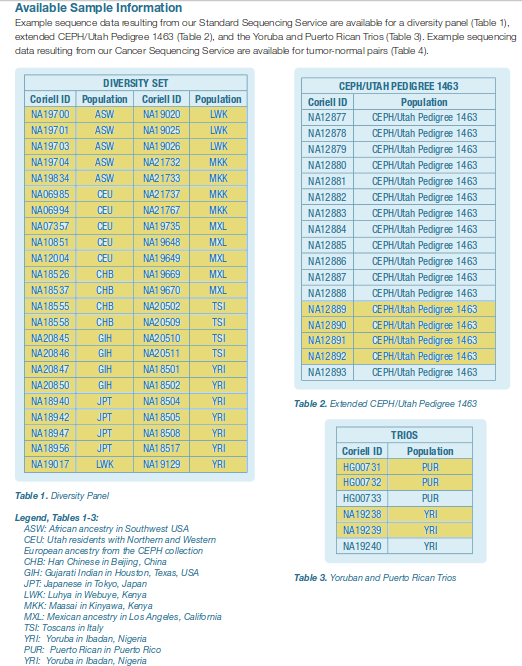
[click to enlarge]
69 human individuals from 11 distinct populations whose genomes have been
sequenced to high coverage by Complete Genomics. 54 unrelated individuals
(highlighted in yellow) were used to assess sequence polymorphism for humans.
Taken from the
Complete Genomics documentation.
|
|
|
2. Outgroup sequence data and ancestral priors
|
|
Divergence was inferred using three primate outgroup genomes:
chimpanzee (panTro2), orangutan (ponAbe2), and rhesus macaque (rheMac2).
We used the alignments of these genomes to the human reference (hg19) downloaded from
the UCSC Genome Browser, and for each position in hg19, we recorded the aligned base
from each of the three nonhuman primates, or an indication that no syntenic alignment
was available at that position (see filters).
A prior distribution for the ancestral state (Z) was computed
for all non-filtered sites in hg19, by assuming
a phylogeny estimated from four-fold degenerate sites (see Figure), and
applying the postprob.msa function in
RPHAST.
The human (hg19) sequence was masked in this computation, so that the computed
distribution corresponds to the distribution over the bases in the ancestral sequence
(Z) given the chimpanzee, orangutan, and rhesus machaque sequences,
which is used as a prior distribution (P(Z|O)) by the INSIGHT model.
|
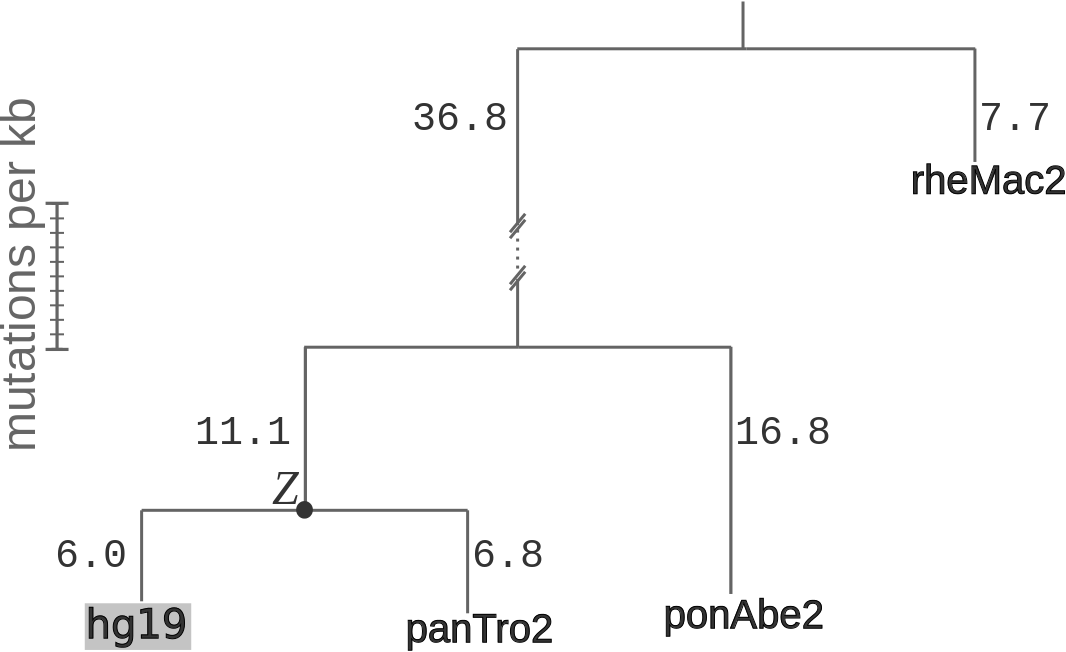
The phylogeny assumed when estimating divergence rates (λ) and prior probabilities
for the ancestral states (Zi). Branch lengths are given in expected number
of differences between haploid chromosomes per kb. The phylogeny was inferred using four-fold degenerate
sites, and was downloaded from the UCSC Genome Browser.
|
|
|
3. Filters
|
|
Our analysis is restricted to the autosomes (chromosomes 1-22), and within autosomes
we applied various filters to reduce the impact of technical errors from alignment, sequencing,
genotype inference, and genome assembly. Our filters included repetitive
sequences (simple repeats), recent transposable elements, recent segmental duplications, CpG site pairs,
regions not showing conserved synteny with outgroup genomes, and regions found in the “black list” filter
reported by Dunham et al. (2012). CpG site pairs (prone to hypermutability) were identified as position
pairs having a “CG” dinucleotide in any of the human samples or the outgroup genomes. As a further
caution, we excluded position pairs with C* in an outgroup and *G in human, to avoid potential ancestral
CpGs. Non-syntenic regions and gaps in the outgroup alignment were masked (by “N”s) individually in each
outgroup genome. This uncertainty was incorporated when estimating the prior distribution over
the ancestral sequence (Z, see above).
Sites with missing genotypes in one of the 54 human individual genome sequences were masked
out completely (see above), as well as sites with more than two observed
alleles in the human population data. We additionally filtered out recombinations hotspots
to ensure a more coherent genealogical background across the genomic blocks (see above).
|
Filters used for INSIGHT analysis of human data.
Links provided to BED files and genomic coverage is given in megabases.
|
|
|
4. Putative neutral sites
|
|
Estimates of neutral model parameters were computed by considering a collection of putative neutral sites that pass our
filters. The collection of putative neutral sites was determined
by eliminating sites likely to be under selection: (1) exons of annotated protein-coding genes and the 1000
bp flanking them; (2) conserved noncoding elements
(identified by phastCons) and 100 bp flanking them; and (3) RNA genes from GENCODE v.11 and 1000
bp flanks. While a fraction of the remaining sites is likely to be functional, this set should be dominated
by sequence evolving under neutral drift
(see Fig. 4A in our paper).
|
|
|
5. Genomic blocks
|
|
For estimation of genome-wide neutral polymorphism and divergence rates, we used a
fixed collection of 10kb ovelapping windows.
The windows were computed by first filtering out recombination
hotspots estimated using the 1000 Genomes genetic map (downloaded from the 1000G
FTP site),
and then covering the portions between adjacent hotspots by 10 kb overlapping windows (see Figure). The overlap
between subsequent windows was set to 5kb (other than the two rightmost windows, which might have a longer
overlap), and each 10 kb window was associated with a distinct genomic block b (genomic blocks are non-overlapping).
We used the putative nuetral sites in each 10 kb window to estimate a neutral polymorphism rate (θb)
and a neutral divergence rate (λb), and those estimates were then associated with the appropriate
genomic block.
To avoid noise from sparse data, we masked
genomic blocks with less than 100 putative neutral sites after filtering, and all sites in these blocks were filtered.
The average number of unfiltered putative neutral sites in the remaining blocks is 4,300.
|
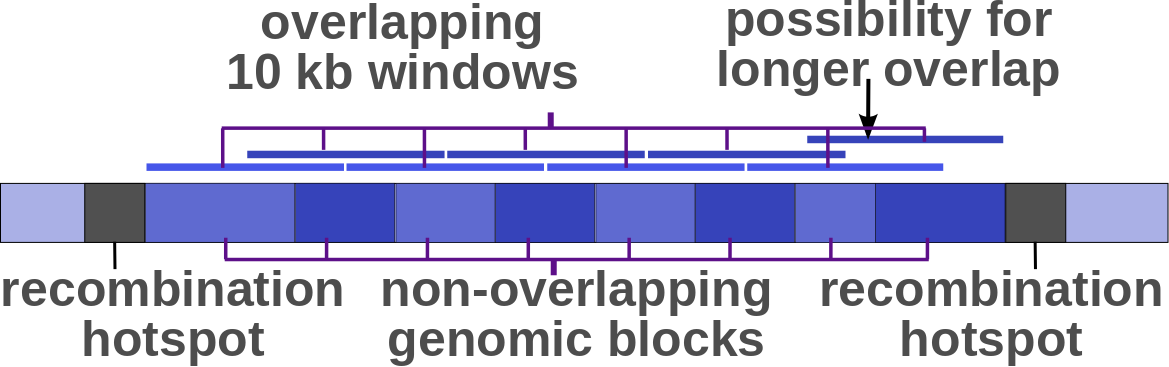
Illustration of the 10 kb overlapping windows used in genome-wide estimation of
the neutral polymorphism rates (θb) and neutral divergence rates (λb),
with the non-overlapping (5 kb) genomic blocks these values are associated with.
|
|
|